Common name:
Y axis
X axis
Limit10050000Currently selected: 1000 events
Depending on the limit chosen, the request can take up to a few minutes to complete.

Pre-annotations

Pre-annotations are annotations that have been completed by the STOAT team using publicly available species occurrence data (GBIF, eBird, Movebank). The results of these annotations are stored in STOAT for rapid visualizations (eventually downloads) by users.

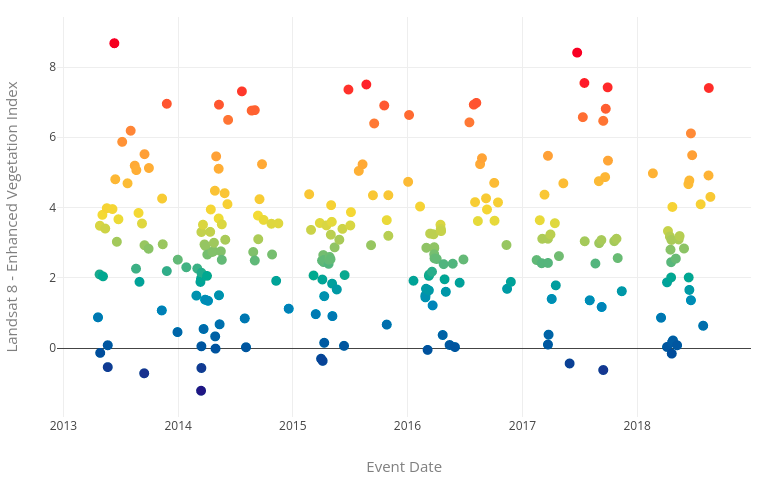
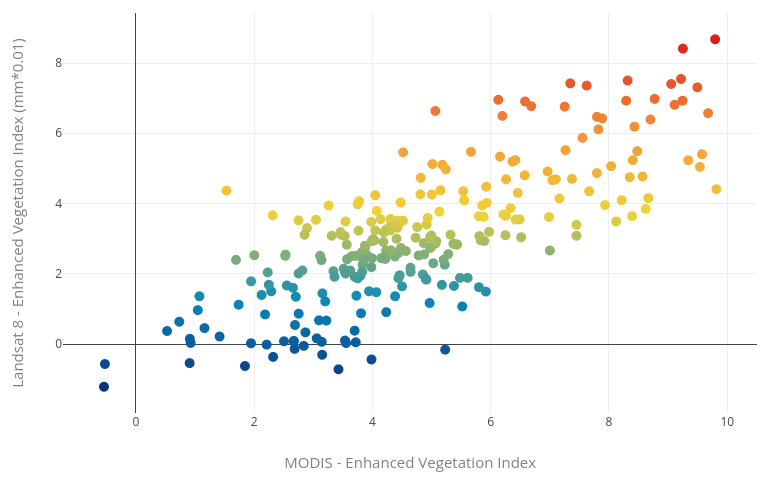
Temporal vs Bivariate
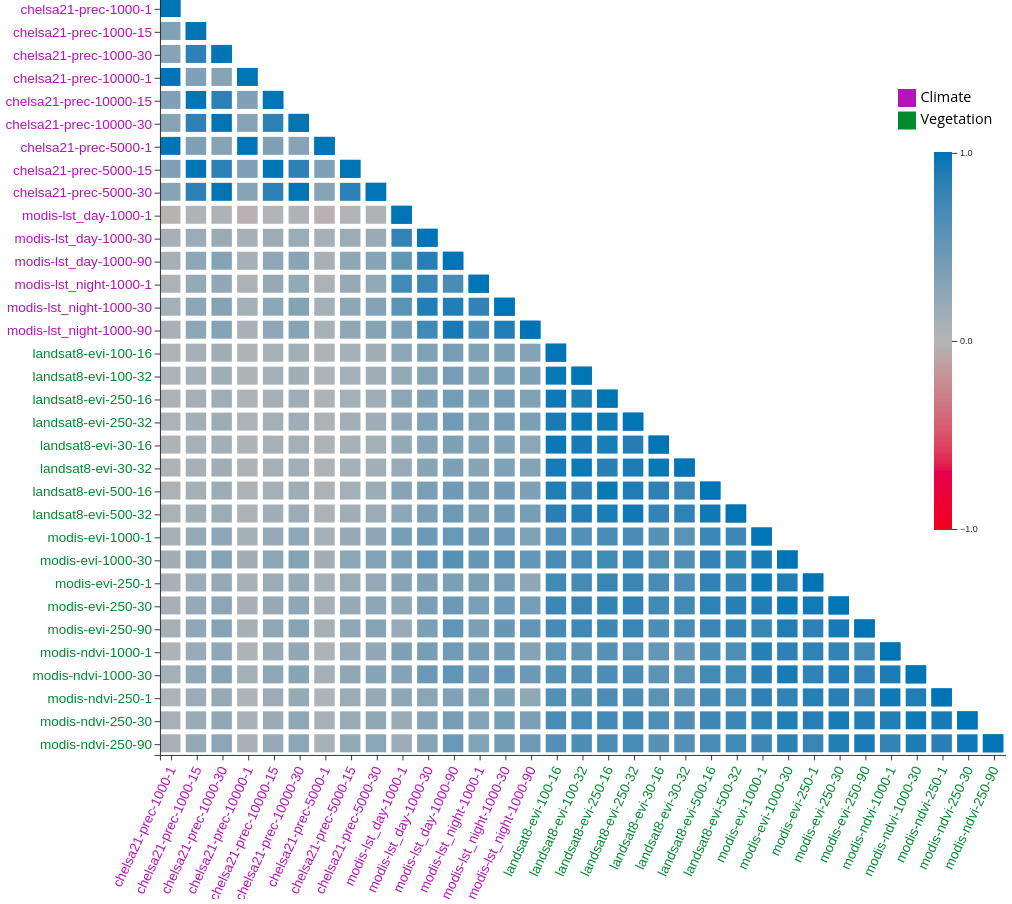
Temporal (Sample)
A temporal analysis has only one variable involved. In the chart above we can analyze Landsat 8 - Enhanced Vegetation Index to observe the values over a given series of events. To view a sample of this, simply plot below to plot a variable selected by us.
Bivariate (Sample)
A bivariate analysis explores the correlation between two events. In the chart above we're plotting Landsat 8 - Enhanced Vegetation Index against Modis - Enhanced Vegetation Index. To view more of this, select plot to view a bivariate scenario selected by us.

Correlation matrix

The correlation matrix displays the relation between each events and allows users to select each tile to further analyze the two events.
To view the correlation matrix, you can plot one or two events and navigate to the correlation matrix tab.